Troubleshoot high CPU usage on Linux Server
Overview
This article helps you determine which application is causing high CPU usage on your server.
Monitoring CPU utilization and CPU load is essential for optimizing performance. While CPU utilization and load might sound similar, they’re actually quite different.
This article will explain the differences between these two important metrics, how to monitor CPU load with common commands, the impact of high CPU load, and how to bring it under control for improved system performance.
CPU utilization versus CPU load:
CPU utilization is the percentage of work the CPU is handling to manage tasks. CPU load, on the other hand, is a measurement of how many processes are being executed or waiting to be executed by the CPU.
Update system with the latest available packages.
Once you are logged in to your server, run the following command to update your base system with the latest available packages.
For Debian or Ubuntu operating systems
# apt-get update -y
For CentOS or RHEL operating systems
# dnf update -y Or # yum update -y
Determine top CPU consuming processes.
Multiple methods allow a user to determine the top processes based on CPU utilization. The following sections outline each of these methods.
- Check CPU Usage with top Command
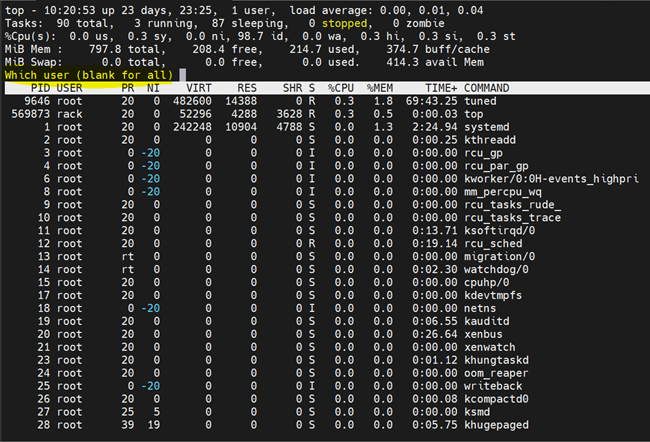
Top is a very useful command-line tool that helps you to monitor all running processes in real-time. It will display the information about the readout of users, tasks, CPU load, and memory usage in real-time. By default, the top command updates the data every 5 seconds.
Now, let’s start using the top command to monitor the CPU usage:
# top
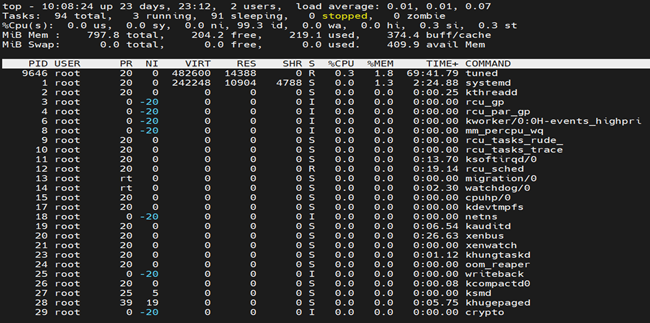
You should see all the running processes on the following screen:
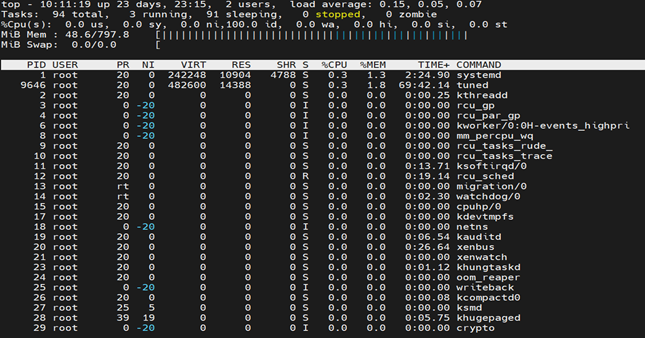
Type “P” to sort all running processes by CPU usage. You should see the following screen:
Type “M” to sort all running processes by Memory usage. You should see the following screen:
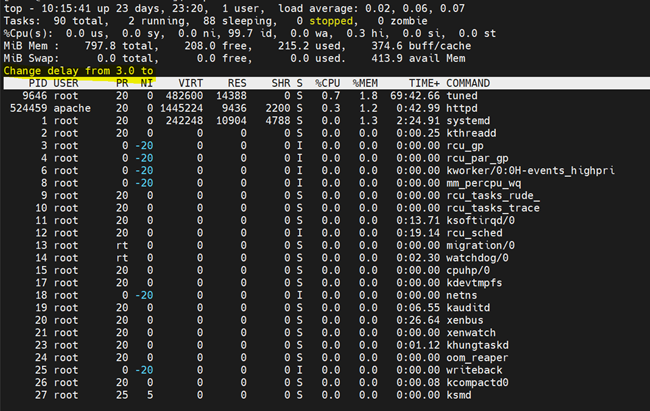
Type “i” to hide all idle processes. You should see the following screen:
Type “S” to sort all processes by how long the processes have been running:
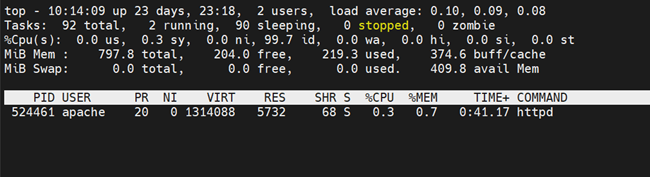
Type “U” to view all processes owned by a specific user. You should see the following screen:
- Check CPU Usage with sar Command
The sar command is also used for collecting and reporting system activity information.
You can use the sar command with the -u option to track CPU performance. The following command will display CPU usage every 2 seconds.
# sar -u 2
Sample output:
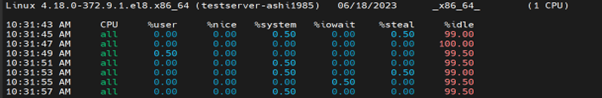
The above command will run indefinitely. You can stop it using CTRL+C.
To learn more working with sar command, please refer the below document link.https://docs.rackspace.com/support/how-to/use-sar-to-monitor-resources-in-linux/
- Check CPU Usage with iostat Command
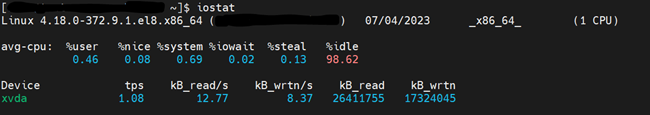
The iostat displays information on device utilization and the system’s average CPU utilization since the last reboot.
Run the iostat command without any option will display the information about CPU utilization, device utilization, and network file system utilization.
# iostat
Sample output:
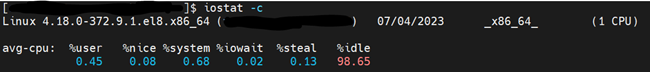
Use the -c option to break the CPU utilization into user processes, system processes, I/O wait, and idle time.
# iostat -c
Sample output:
- Check CPU Usage with vmstat Command
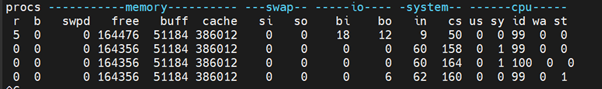
The vmstat command will display the information about system processes, memory, swap, I/O, and CPU performance. It will display the average details since the last reboot.
Run the vmstat command without any options as shown below:
# vmstat
Sample output:

The following command will update vmstat report every 2 seconds:
# vmstat 2
Sample output:
Press CTRL+C to close the vmstat.
- Check CPU Usage with uptime Command
The uptime command is also useful for viewing the load average of the system. This command displays the current system time, the uptime of the machine, the number of users currently logged into the system, and the load averages for the last 1, 5 and 15-minute durations.
#uptime
Sample output:

- Check CPU Usage with ps Command
The ps command is a flexible and widely used tool for identifying the processes running in the system and the number of resources they’re using to run. This command can show different outputs according to various options.
#ps
Sample output:
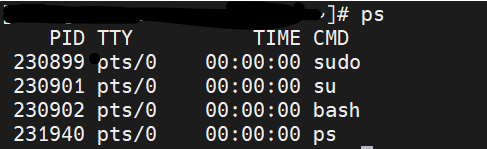
This output displays basic information about the processes running, but it can be customized with options provided by the ps command to yield more details.
For example, we can view and sort which processes are using the most CPU by running the following command:
# ps -eo pcpu,pid,user,args | sort -k 1 -r | head -10
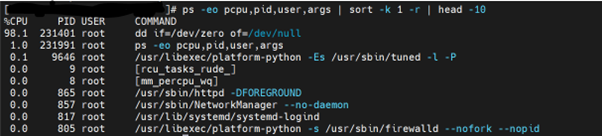
The ps command doesn’t display the load averages of the system, instead, it’s used to troubleshoot the cause and find the processes that are causing the high CPU load. For example, if a process is using 100% of the CPU, the other processes will have to wait for the CPU and the load on the CPU will increase.
This command also helps to identify the processes that are being spawned repetitively or are in a zombie state.
Fixing high CPU load
You can determine the best way to resolve or prevent high CPU usage, depending on the process causing the high CPU usage. Following are a few examples and some general recommendations to help you resolve high CPU usage:
Kill or restart processes: Often, there are just one or two processes increasing the CPU load. For example, a process could be in an uninterruptible state and increase the load on the CPU by keeping all other processes waiting. The first thing to do when the CPU becomes overloaded is to identify any processes of this kind and terminate or restart them.
Update system apps and drivers: Outdated drivers and apps can also cause high CPU load because they can’t effectively perform the I/O operations. The best way to avoid this issue is to ensure the entire system is up to date.
Reinstall or downgrade apps: Sometimes, simply reinstalling an app that was causing a high CPU load can resolve the issue. If not, switching the app to a lower or previous version might improve the performance.
Reboot the system: If nothing else seems to work and you can afford the downtime, rebooting the system may solve the problem. Though it may not be possible every time, especially if the system is a server that can’t be shut down.
General Recommendations when you don’t identify a single top consuming process
When a single top consuming process fails to stand out, perform a reboot. If you notice high resource usage for an extended period, even after rebooting, the device might not have sufficient resources for its purpose. In this case, options include migrating high usage applications such as MySQL /MariaDB or Apache/Ngnix to other servers or resizing the server to add additional resources.
Updated 5 months ago