Understanding the Rackspace Intelligence Dashboard User Interface
Rackspace Intelligence monitors the performance and availability of infrastructure and, when limits are exceeded, can respond by notifying or suppressing a notification.
When you log in to Rackspace Intelligence, you can view all your relevant information on the dashboard:
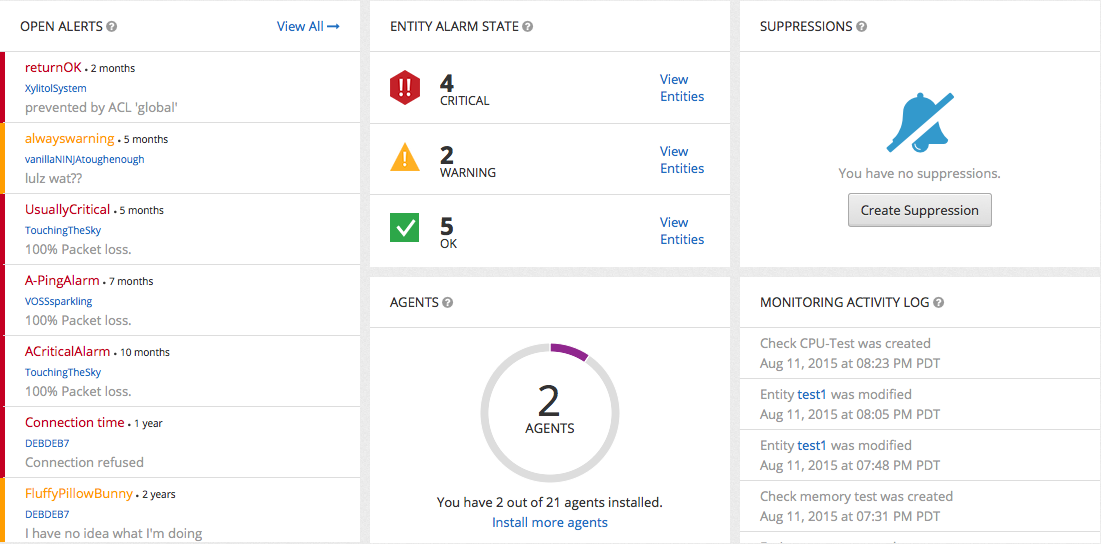
The dashboard provides an overview of all of your monitoring activities.
You can also examine different aspects of Rackspace Intelligence configuration to monitor your system by accessing the following sections from the header:
- Monitor
- Suppress
- Notify
- Visualize
Within each section, you can refine your focus by choosing from the offerings in the section. For example, in the Monitor section, you can choose to work with entities or open alerts.
In some areas of the interface, the Actions menu is available. For example, if you create an entity
in the Monitor section and provide basic information about it, the Entity Details page contains an Actions menu. You can use the menu commands to rename, define an IP address, delete it, and create checks or suppressions for the entity.
By understanding the structure of these sections in the Rackspace Intelligence interface, you can predict where to find the information and tools you need.
Updated 4 months ago